
Track bookings
View the activity in your bookings.
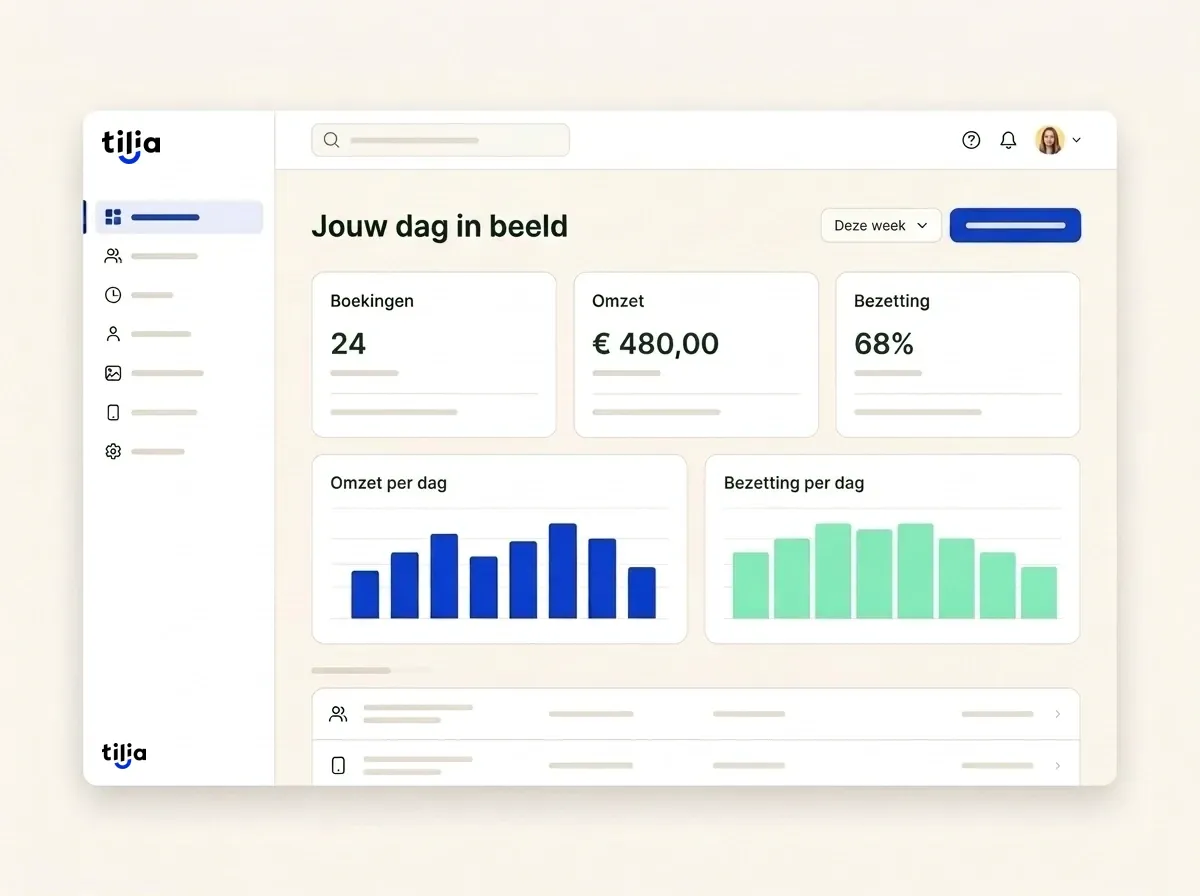
From occupancy to sales: consolidate the information from your leisure business and plan ahead with a clearer overview.
Request a demo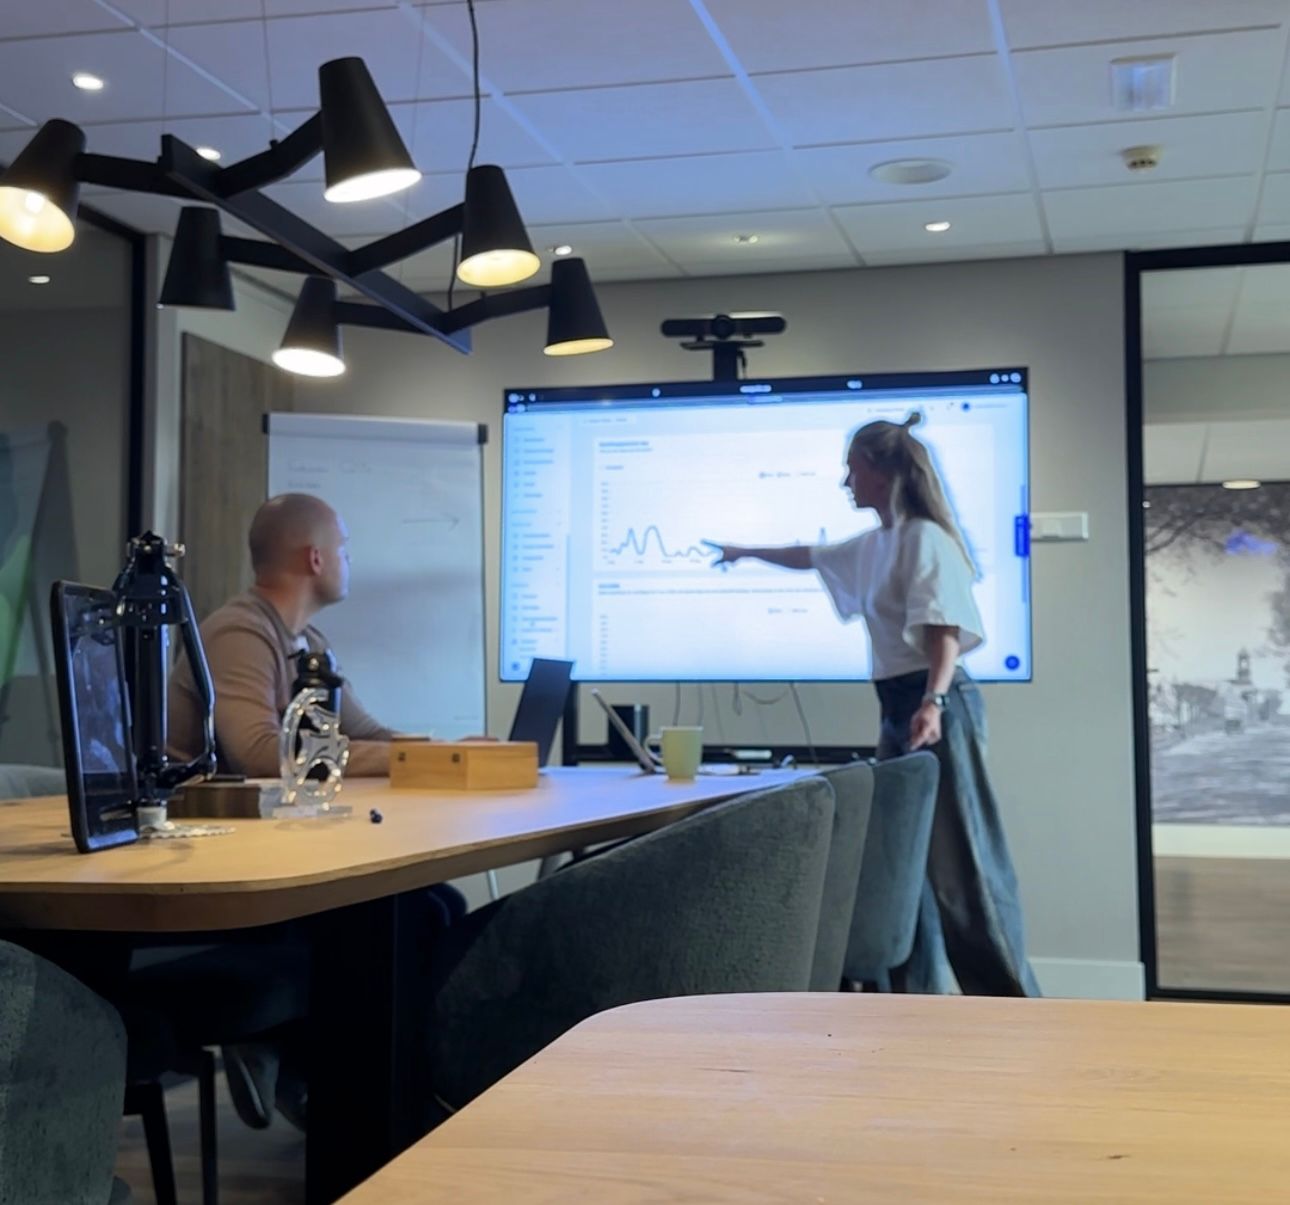 Insights & reports
View the activity in your bookings.
Include your till and payments in the overview.
Look at your business from a shared perspective.
What was busy? Where was there still space? Coherent information helps you to plan for the next day and the next season.
Keep track of what’s happening in your business right now.
Monitor revenue and cash flow alongside your day-to-day operations.
See where capacity is being used and where there is still room.
Check upcoming availability and occupancy.
Use reports on sales, transactions and fleet value.
Export data to Excel or CSV.
No. Tilia has live dashboards with up-to-date figures. These allow you to monitor what’s happening in your business throughout the day.
Yes. The analytics module supports turnover and cash flow reports. This allows you to view both the revenue and the cash flows from your business operations.
Tilia provides insight into occupancy and utilisation. You can also look ahead to future availability and occupancy to assess your planning.
There are reports covering sales, transactions and fleet value, amongst other things. In the demo, we’ll look at what information you need for your daily or regular meetings.
Yes. You can export data to Excel and CSV. This allows you to continue working on your own reports outside of Tilia.
A dashboard helps you keep track of the current situation. Reports provide a more detailed breakdown of a topic, such as sales or fleet value, for analysis and discussion.
Can’t find your question here? Ask Tilia your question
We’d be delighted to show you how Tilia can provide you with this insight.